DATA: See it. Understand it. Discuss it.
 We’ve all heard author and management consultant Peter Drucker’s famous quote “If you can’t measure it, you can’t manage it.”
What’s the right way to manage “It” though? Is it enough to put the data in the hands of the responsible manager and wait for change to occur? Does the manager have a pulse on everything that went into those numbers?
Your numbers tell a story, but there is a lot of “how” and “why” that creates a backstory that affects the interpretation and the actions needed to improve. Does your manager have the backstory? Probably not, so you share the numbers and invite employees to participate in the discussion, only to discover that the 3rd shift was short-staffed for over a week, or a material shortage caused a delay in order fulfillment, or quality issues resulted in a large amount of rework, thereby delaying other production runs. How do you get ALL of this information without the need to discuss it with each person doing the work?
D A S H B O A R D S ! See it. Understand it. Discuss it.
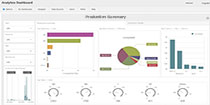
Production
Summary
OEE, time usage, downtime, quantities, cycle times, and more...
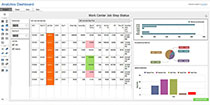
Work Center Job Step Status
OEE, time usage, downtime, quantities, cycle times, and more...
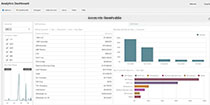
Accounts Receivable
Summary
Revenue, income, working capital, assets,
and more...
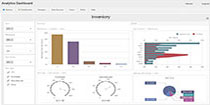
Inventory
Dashboard
Planning, sourcing, procuring, transporting, storing, and more...
Dashboards are key to transforming your data into meaningful action that boosts performance. They show key performance indicators so employees can discuss what's going well, and what needs to be improved. Display Dashboards on individual computers, or tablets, or broadcast on big monitors in common work areas so your teams can establish a cycle of continuous improvement.
Crossroads RMC’s Analytics Dashboard product provides a meaningful tool for team discussion and improvement.
Request a demo or get started with a FREE 30-DAY TRIAL today.
(Includes pre-built views for Infor LN, Infor LX, Baan, and BPCS)
Request a Demo / Free 30-Day Trial > Infor LX or BPCS
Learn More > Infor LX & BPCS
Request a Demo / Free 30-Day Trial > Infor LN or Baan
Learn More > Infor LN & Baan