Configure Data Any Way You'd Like
No programming required. No changes to Infor ERPs.
What is NextTrack Insights?
NextTrack Insights is real-time business intelligence software that empowers your team to track, analyze, and visualize data instantly, so you can make better decisions without waiting on IT or custom reports.
With drag-and-drop dashboards and AI-powered insights, you’ll have a clear view of your business performance—whether at the organization, department, or process level.
Why NextTrack Insights?
Real-Time Visibility
Access live data directly from your ERP system. No manual exports. No stale reports.
AI Integration
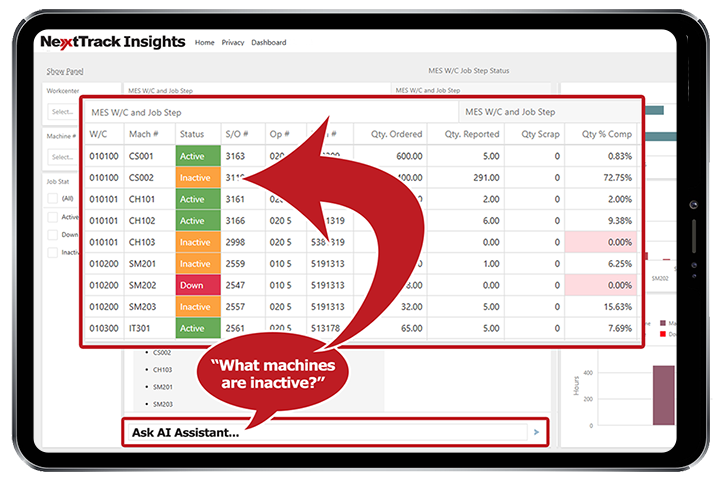
Ask questions in plain English:
-
“Which machines are down?”
-
“Are we on track to meet production targets?”
-
“Where are labor bottlenecks affecting throughput?”
No Coding Needed
Create and customize dashboards with clicks, not code.
ERP-Agnostic Flexibility
Works across platforms, with direct connections today for Infor ERP LX, XA, and Db2 for i.
Actionable KPIs
Monitor cycle times, equipment effectiveness, downtime, labor history, and more.
Modernized & Future-Ready
Rebuilt on .NET Core with robust API integrations, NextTrack Insights delivers:
-
Lightning-fast performance
-
Seamless compatibility with AI models like OpenAI GPT-4.1
-
Customizable charts, grids, and reports
-
Easy export and sharing across teams
Perfect for:
-
Executive Management – High-level KPIs and trend analysis
-
Supervisors – Real-time production and labor tracking
-
Shop Floor & Warehouse Displays – Visual status boards that keep everyone aligned. Share with a click of a button
Ready to unlock insights from your ERP data?
Get a demo